What is autoRPA?
autoRPA is an online service that can construct prognostic staging models and perform performance comparison between different staging models. By using Recursive Partitioning Analysis (RPA) and the log-rank test statistics, autoRPA will provide an intuitive way for building decision-making tree from survival data. According to their clinical knowledge and experience, users can further prune the survival trees in an interactive way to build a more feasible model. Using a permutation test, autoRPA can evaluate the contribution of each submitted factor and help singling out factors that significantly contributed to cancer staging. Four indicators, including hazard consistency, hazard discrimination, percent variance explained, and balance, are introduced in autoRPA to validate the staging performances. In addition, autoRPA can compare the performances of different prognostic staging models using a standard bootstrap evaluation methods. To make it more convenient to the users, autoRPA also provides a visualization module for all the above analysis results.
Creating input files
When you run Online Modeling module or Models Comparison module, autoRPA displays the parameters for the selected modules. Often, one or more of these parameters are input files, which must have a particular format; for example, you might need to supply survival data or prognostic model file. For more information about a particular file format, select it from the list at the right.
This section provides general information to help you create properly formatted files for autoRPA.
RSD format Files used in Online Modeling module:
autoRPA defines a file format for RPA survival data: RSD format. It is a tab-delimited text files. The first row indicates the name of covariates. The second row indicates the type of covariates. "t" implies the survival time; "d" is for censoring indicator (1=death, 0=alive); "o" implies a continuous covariate; and "i" implies a categorical covariate. RSD format files do not allow missing values.
An example for RSD format: Download
RMD format Files used in Models Comparison module:
autoRPA defines a file format for RPA model data: RMD format. It is a tab-delimited text files. The first row indicates the name of covariates. The first column indicates survival time; the second column indicates censoring indicator (1=death, 0=alive); the last column indicates the prognostic stage; and the other columns indicates covariates involved in the model. RMD format files do not allow missing values.
An example for RMD format: Download
How do I use it?
Derive a prognostic staging model
1. When you choose Online Modeling, a page will appear as shown below:
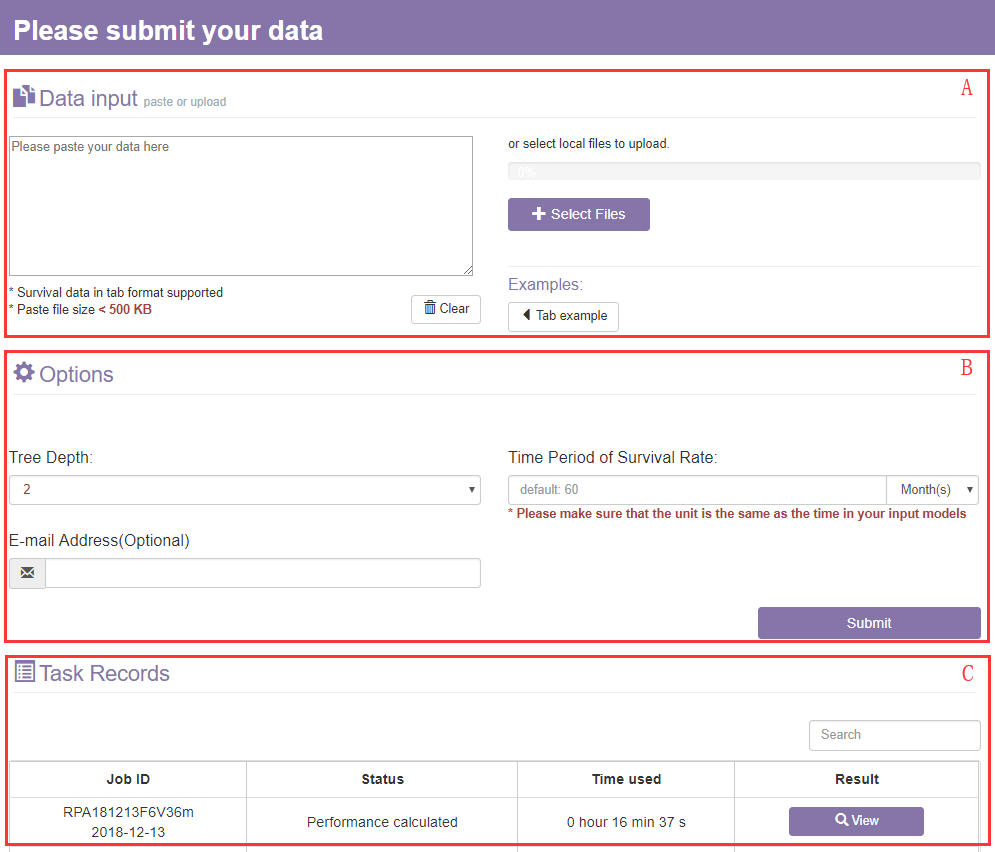
The online modeling page contains the following settings for the input:
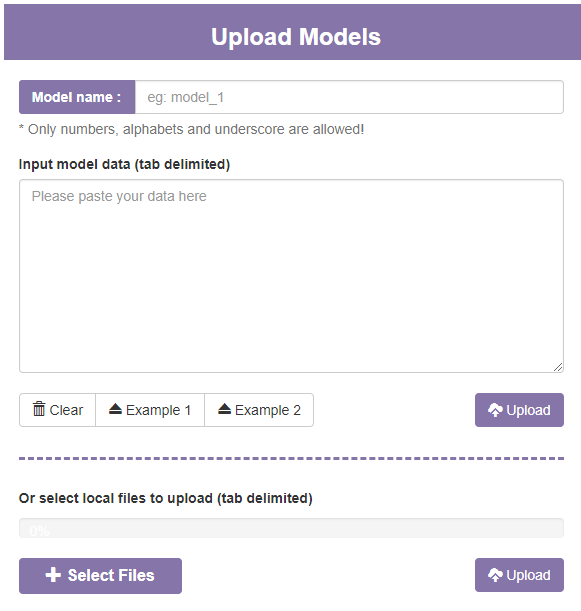
A. The data input section
Firstly, to use autoRPA you will need to upload a data file or paste a text in tab format.
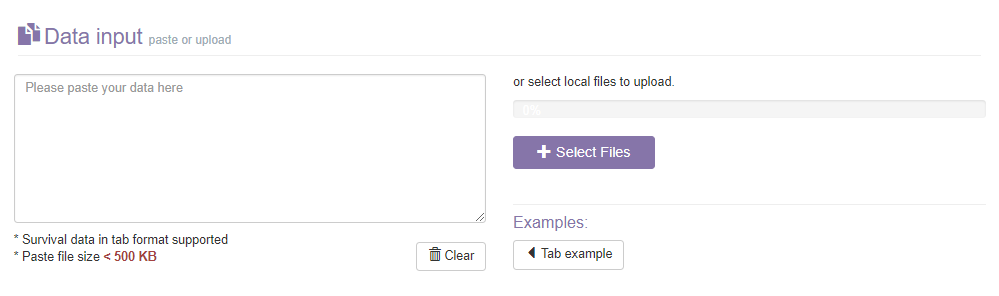
- 1) The data pasting panel: Paste a tab formatted text in tab format. Click Clear button to clear the text in the data pasting panel.
- 2) The File panel: In addition to pasting text in the input panel, you can also upload a tab formatted data file via select file button.
- 3) The Example button: Load a tab example in the input panel.
An example for RPA survival data: Download
- The first row indicates the name of covariates.
- The second row indicates the type of covariates. "t" implies the survival time; "d" is for censoring indicator (1=death, 0=alive); "o" implies a continuous covariate; and "i" implies a categorical covariate.
B. The options section
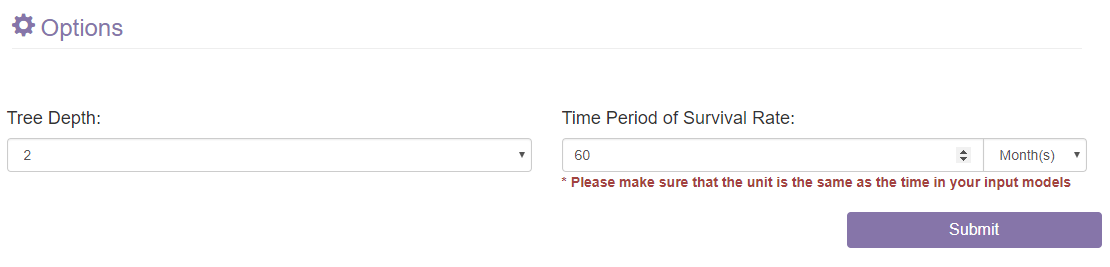
- 1) The Tree Depth panel: Set the depth of the decision-making tree.
- 2) The Time Period of Survival Rate panel: Set the time period of survival rate for the inputted survival data. Please make sure that the time unit of the input text is as the same as the setting here.
- 3) The Submit button: When all the options are set, you can click on the Submit button to start model building.
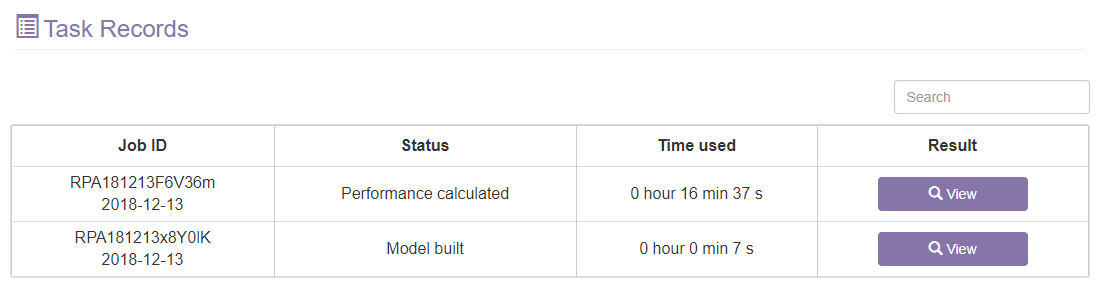
C. The task records section
After the tasks are finished, you can click the view button to access the result.
2. The initial model result will appear as shown below:
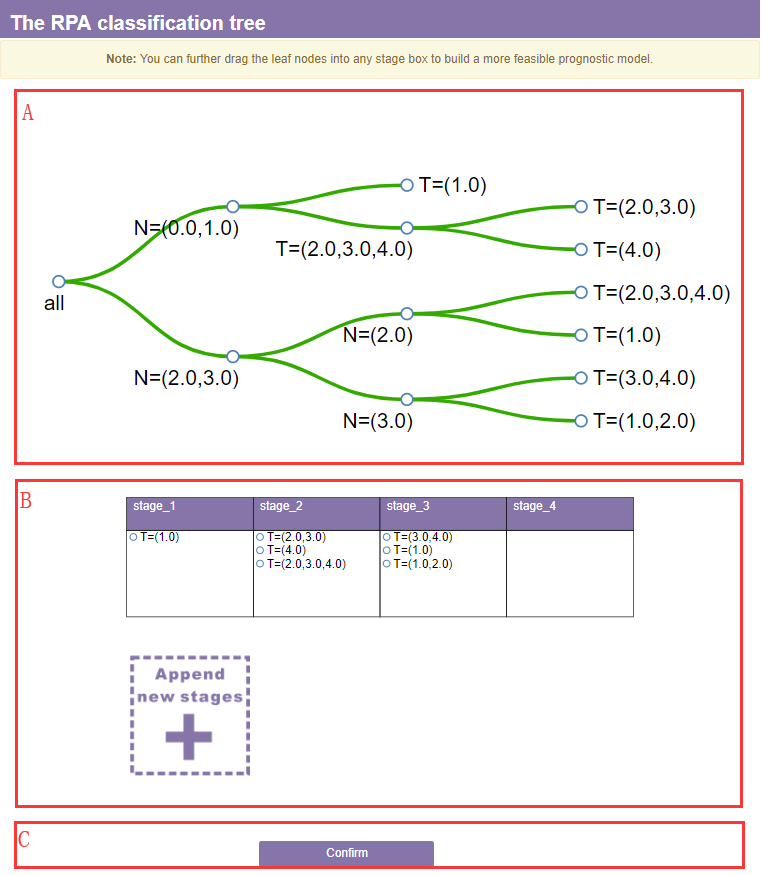
A. The tree section
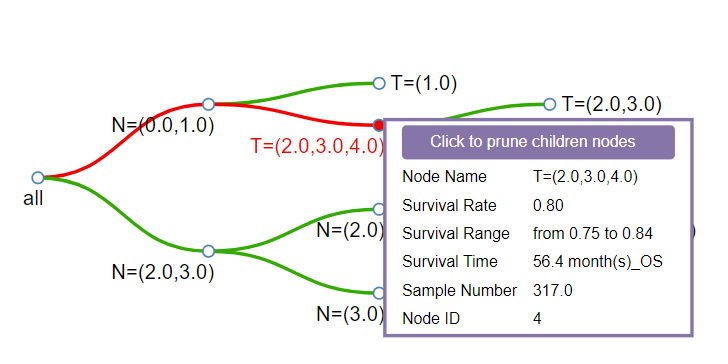
1) The detail dialog: When the mouse moves to any node of the tree, more details of the node would be shown in a dialog. You can click the upper button to prune children nodes.
- Node Name: It consists of the factor which is used to divide the parent node into two children nodes.
- Survival Rate: The survival rate of the node at the time period below.
- 95% CI: 95% confidence interval of the survival rate.
- Sample Number: The sample size of the node.
- Node ID: Each node has a unique ID.
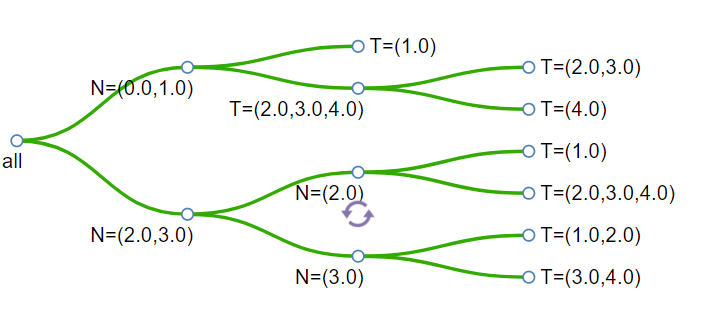
2) Rotate button: When the mouse moves to any pair of children nodes, the rotate button will appear. You can click on it to rotate the children nodes.
B. The stage section
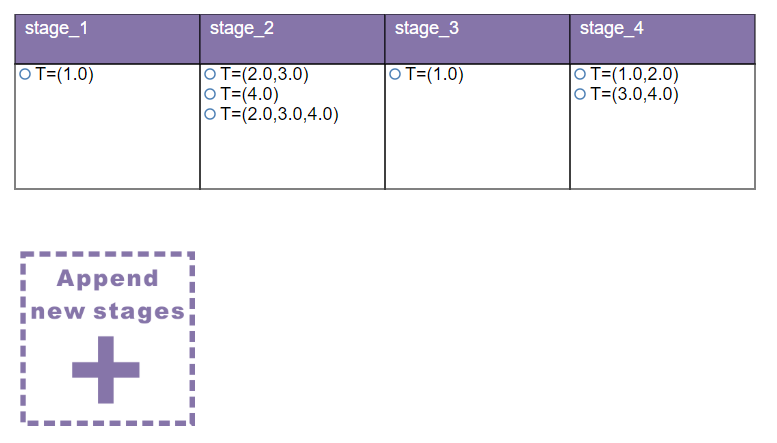
All the leaf nodes will consolidated into a stage table according to their survival rates. You can further drag the leaf nodes into any stage box to build a more feasible prognostic model according to your clinical knowledge.
C. The Confirm button
Finally, when you click the Confirm button, autoRPA would calculate performance of the prognostic staging model.
3. The performance page of a confirmed model will contain four sections including the model visualization section, the survival validation section, the property statistics section, and the contribution statistics section.
A. The model visualization section
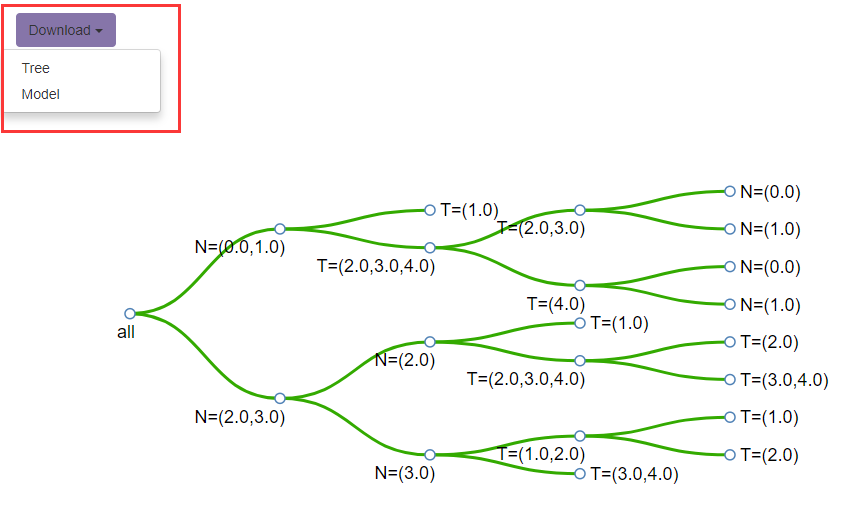
This section will show the decision tree and the staging table of the confirmed model to the users. There is a Download button for saving the RPA decision-making tree in SVG format and the model file in tab format.
An example for RPA model file: Download
- The first row indicates the name of covariates.
- The first column indicates survival time; the second column indicates censoring indicator (1=death, 0=alive); the last column indicates the stage of RPA model; and the other columns indicates covariates.
B. The survival validation section
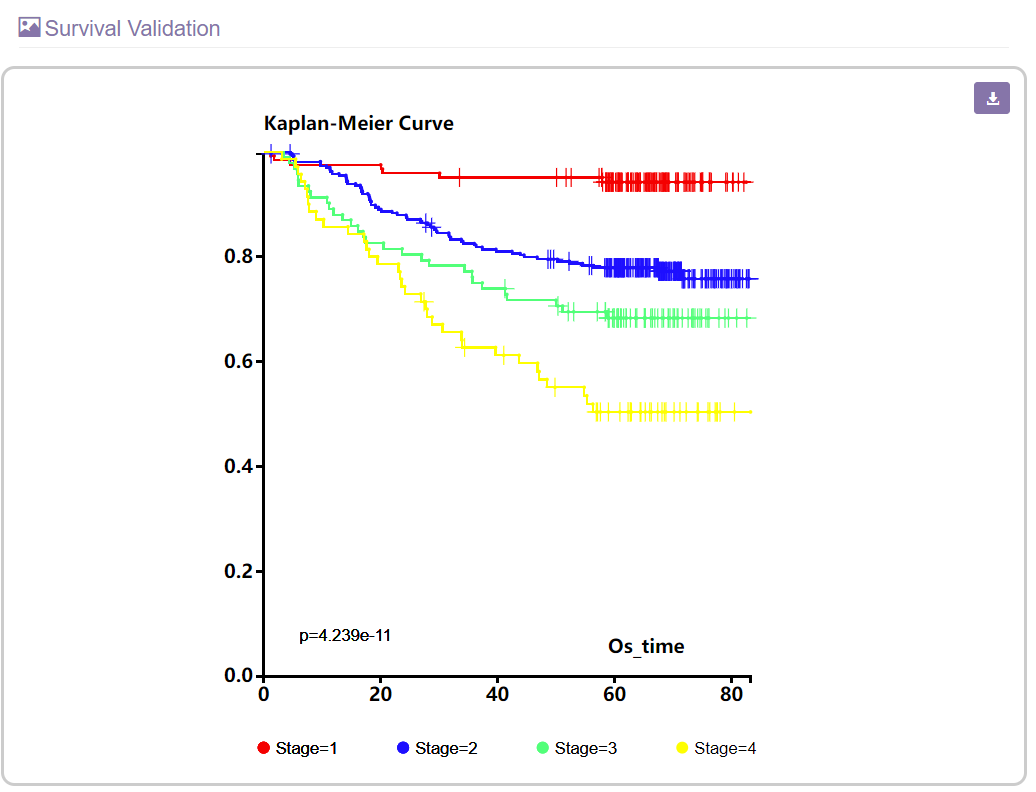
This section will show a Kaplan-Meier plot for comparing the survival rate of each constructed cancer stage.
C. The property statistics section
This section will show the performance of the constructed model by presenting four indicators in a table.
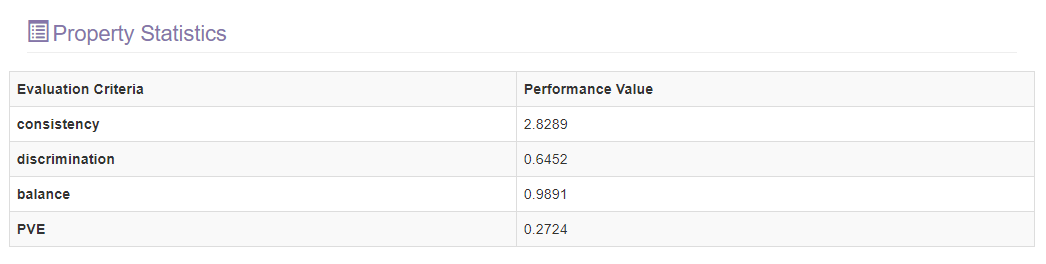
- Consistency: The similarity of survival rates for subgroups defined by covariates within each stage group. The lower value means better performance in this criteria.
- Discrimination: The differences in survival rates across the stage groups to assess how equally they are spaced. The lower value means better performance in this criteria.
- PVE: The percentage of overall survival variation explained by the stage groupings. The higher value means better performance in this criteria.
- Balance: The difference of different stages’ sample size. The lower value means better performance in this criteria.
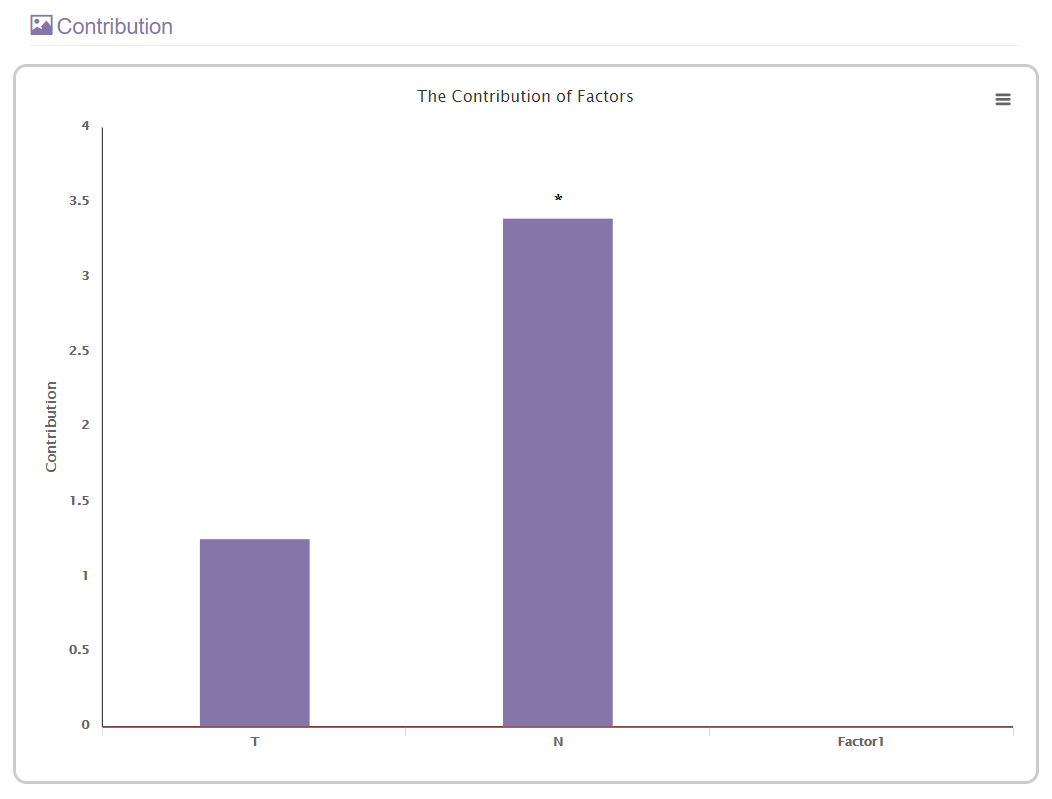
D. The contribution statistics section
This section will present the contribution of each submitted covariate in a histogram. The contribution value indicates.
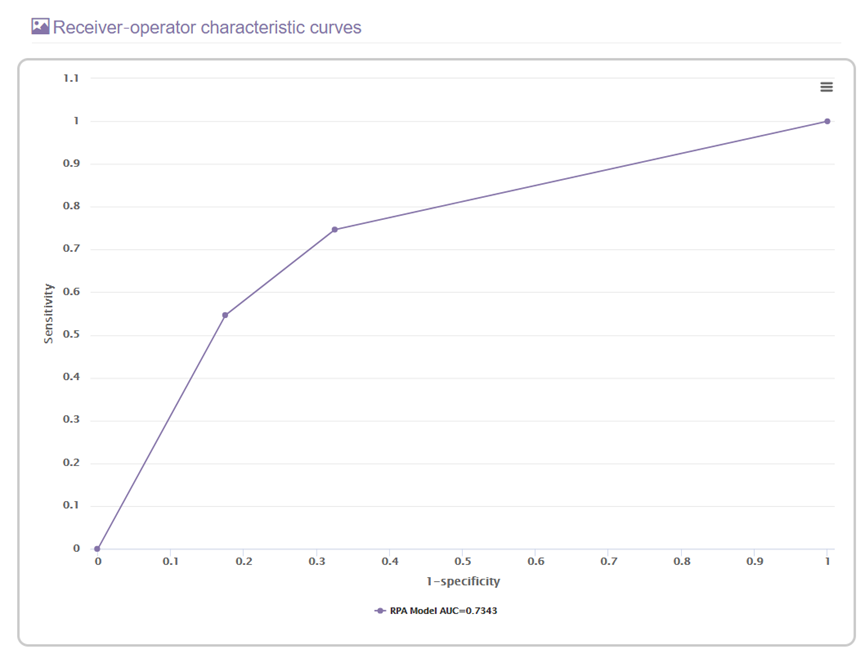
E. The receiver operator characteristic section
This section will present the receiver operator characteristic curve of the RPA model.
Compare different prognostic staging models
1. When you choose Models Comparison, a page will appear as shown below:
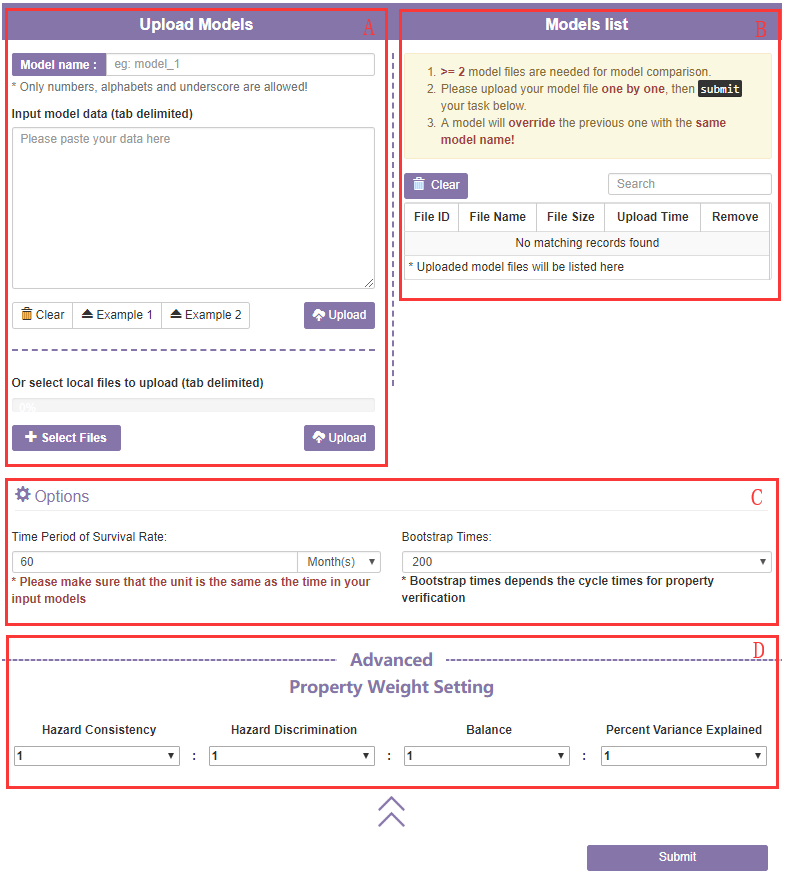
A. The data input section
Firstly, you will need to upload model files or paste texts in tab format.
An example for model file: Download
- The first row indicates the name of covariates.
- The first column indicates survival time; the second column indicates censoring indicator (1=death, 0=alive); the last column indicates the prognostic stage; and the other columns indicates covariates those involved in the model.
B. The model list section
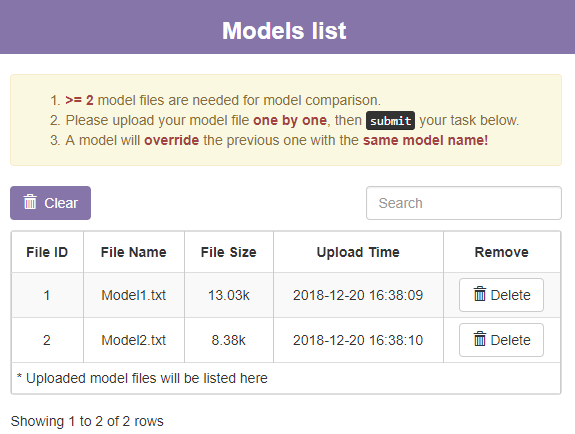
This section will show a table of models you uploaded. You can click Delete button to delete one of the model or click Clear button to delete all models.
C. The options section
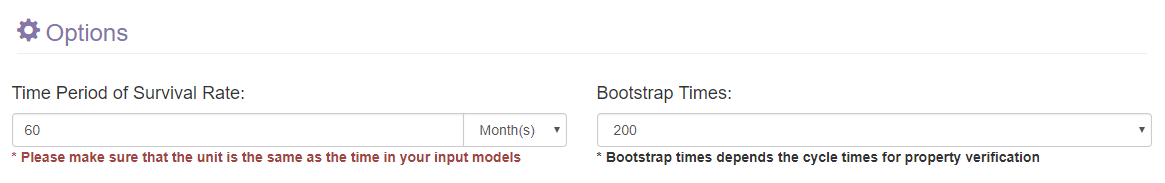
- 1) The Time Period of Survival Rate panel: Set the time period of survival rate for the survival data in models. Please make sure that the time unit of the input text is as the same as the setting here.
- 2) The Bootstrap Times panel: Set the iteration times for bootstrap analysis.
D. The advanced section
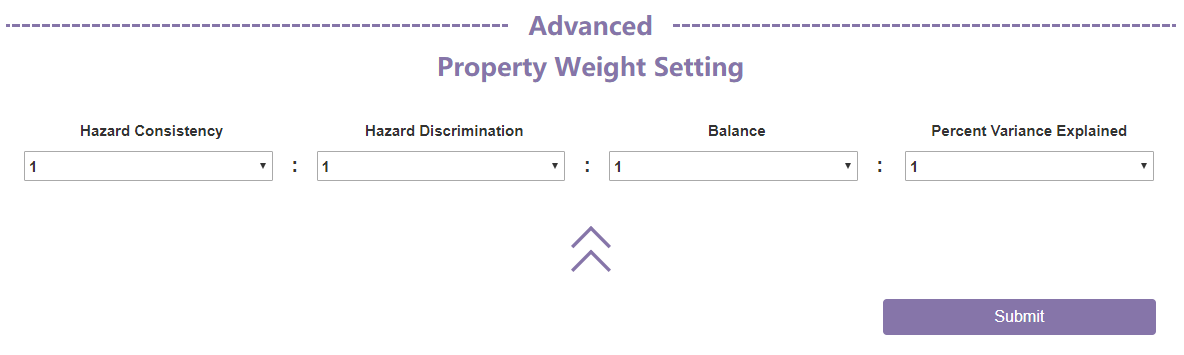
You can specify weight for every evaluation criteria in this section. The weights will be used to compute the combined score. All the weights will be set as 1 in default.
2. The model comparison result will contain two parts, a table of performance evaluation and a radar map.
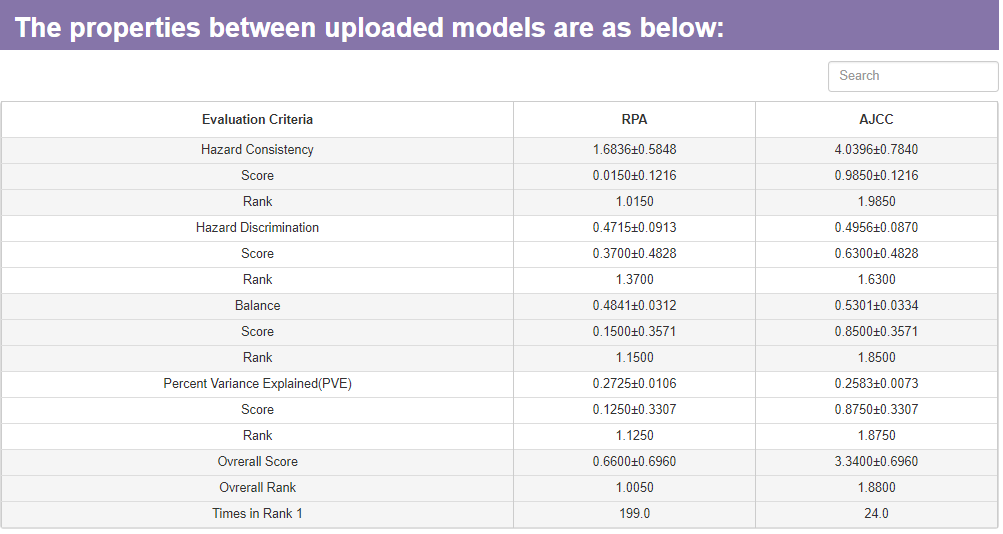
This table will show four kinds of stage performance evaluation criteria and their standardized score. All the stage performance evaluation criteria have been defined in the above. The table will also show the average rank for each model in every criteria.
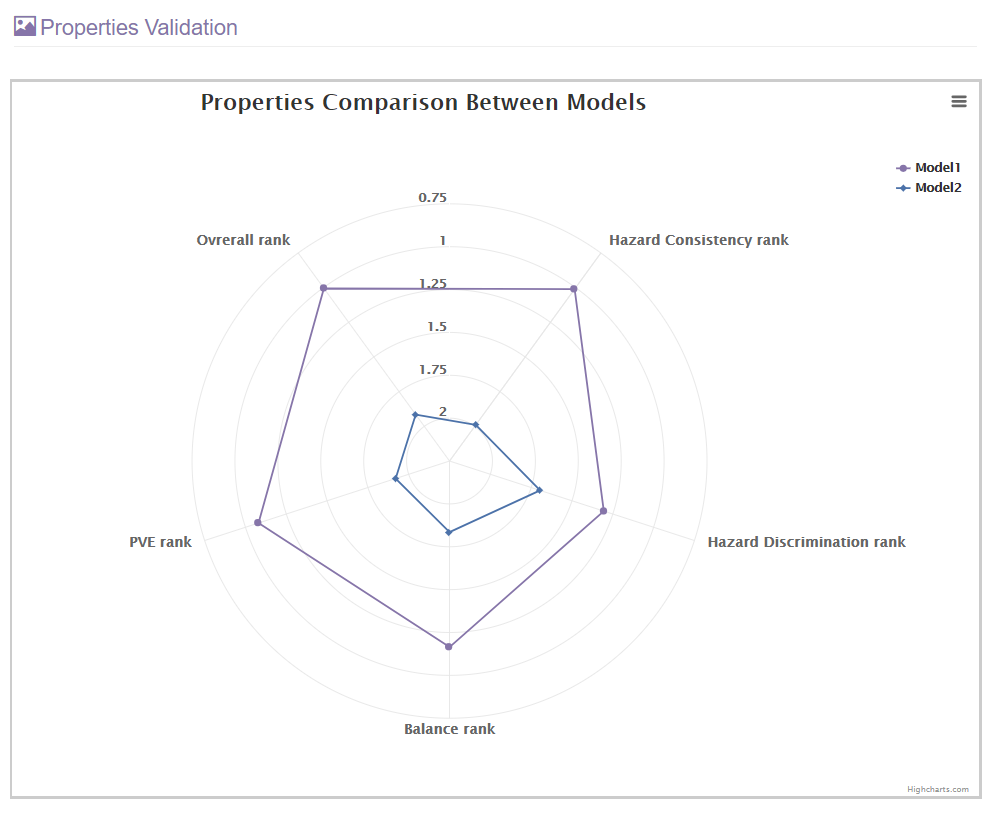
The performance of all staging models will be visualized in this radar map.
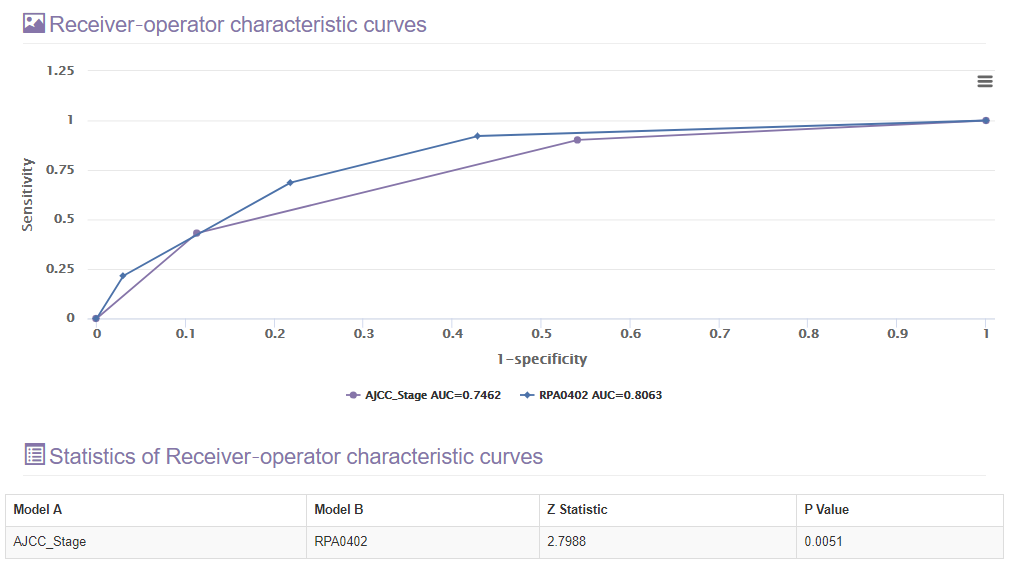
The area under the receiver-operator characteristic (ROC) curve also was used to assess the predicted validity of different models. This section will also show the comparison result between each two ROC curves.
I'm having trouble with autoRPA that isn't addressed on this page. What should I do?
If you are having trouble with autoRPA please contact the two major authors: Dr. Jian Ren and Dr. Zhixiang Zuo. We will try to resolve it.